Kaito Volume Drops 80%: Will the Price Rally Continue?
2025-02-26
KAITO, the governance token of the AI-powered project, made a strong debut on February 20. Within just a day, its trading volume soared to a staggering $3 billion, reflecting heightened interest in the cryptocurrency.
The surge in volume was primarily fueled by the KAITO airdrop, which released nearly 20% of its total supply into the market. While the initial development induced selling pressure, the market later stabilized.
However, despite this, current volume data indicates a waning interest in KAITO. Nevertheless, the potential for a continued price rally remains strong.

Interest in KAITO Drops
On February 21, KAITO’s price surged to the $2 mark, establishing the altcoin as one of the top performers of the previous week. The trading volume, simultaneously climbing to $3 billion, highlighted robust market momentum. Typically, increasing volume along with a rising price signals a bullish trend, reinforcing the uptrend’s strength.
Source: Coinmarketcap
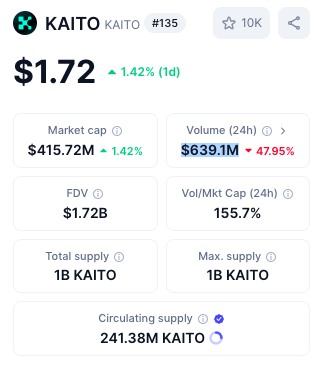
Conversely, a declining volume often raises caution about potential price drops. As of this writing, KAITO’s trading volume has dropped below $580 million, contributing to a recent price pullback to $1.67. However, the token demonstrated resilience, gaining 7% in the past 24 hours, suggesting renewed demand.
Read Also: KAITO Airdrop Launch: A Game-Changer for the Tokenized Attention Economy
KAITO Price Targets New All-Time High
Technical analysis of KAITO’s 2-hour chart aligns with the potential for further gains. The Bull Bear Power (BBP) indicator shows a positive reading, suggesting bullish dominance. A green histogram bar from BBP indicates that bulls have the upper hand, potentially driving prices higher.
Source: Bitrue Spot Trading
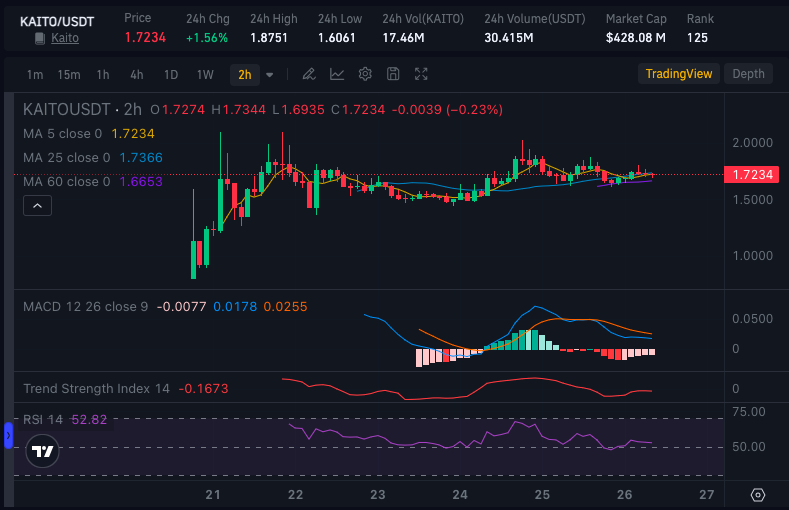
Additionally, the Relative Strength Index (RSI) remains above the 50.00 neutral mark, signaling bullish momentum. Should the RSI maintain its upward trajectory, KAITO’s price could climb to the 0.236 Fibonacci level, potentially reaching $2. A sustained increase in demand might push the token to a new high of $2.25.
Read Also: Kaito Crypto Price Prediction for 2025: Monthly Analysis
Market Sentiment and Future Outlook
The broader market sentiment plays a critical role in determining KAITO’s price trajectory. While a positive BBP reading and strong RSI momentum are favorable, external market conditions, such as Bitcoin's performance and macroeconomic factors, could influence KAITO’s direction.
Traders should closely monitor market catalysts, including regulatory developments and AI sector trends, as these elements could affect investor sentiment and trading volume.
Key Levels to Watch
Should KAITO’s price fail to surpass the immediate resistance at $1.84, it may face downside risks, especially if trading volume continues to drop.
The critical support level stands at $1.42, which, if breached, could trigger further bearish sentiment. However, if the volume recovers and demand strengthens, a potential rally above $2 remains viable.
Read Also: Kaito AI Airdrop Season 2: Earn Kaito AI Airdrop $KAITO and Trade on Bitrue
Analyzing Historical Volume Trends
Looking back at KAITO's historical trading patterns, the volume surge following its launch is not unprecedented. Many airdrop-driven tokens experience similar spikes as early investors capitalize on liquidity.
Source: Coingecko
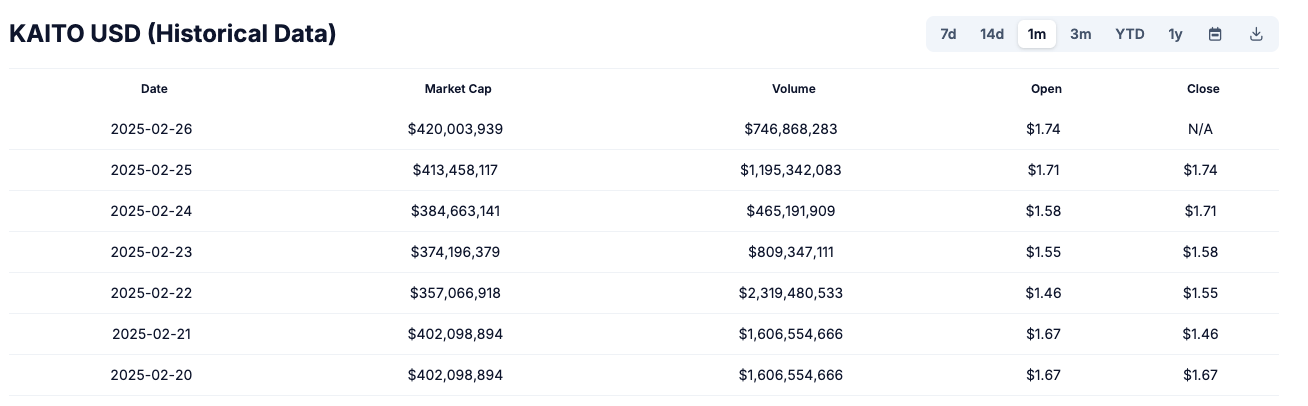
However, maintaining high volume levels is crucial for sustaining upward price momentum. KAITO’s current volume decline might reflect a natural market cycle, but understanding past behavior can offer insights into future performance.
Technical Indicators Suggest Mixed Signals
Apart from BBP and RSI, additional technical indicators such as Moving Averages (MA) and the Moving Average Convergence Divergence (MACD) offer deeper insights.
Currently, KAITO's price is hovering near its 50-day MA, which often acts as a dynamic support or resistance.
The MACD indicator shows a narrowing gap between the MACD line and the signal line, hinting at a potential trend reversal. Investors should watch for a bullish crossover, which could signal a buying opportunity.
Conclusion
Despite the recent volume decline, KAITO’s bullish indicators and market dynamics suggest that the token’s rally might not be over. Monitoring key resistance and support levels, alongside broader market trends, will be crucial for traders.
As always, conducting thorough research and staying updated on market developments through the Bitrue website is advisable before making investment decisions.

FAQ
Q: What is KAITO’s current trading volume?
A: As of this writing, KAITO’s trading volume has dropped below $580 million from a peak of $3 billion.
Q: What is the predicted price target for KAITO?
A: If bullish momentum continues, KAITO could reclaim $2 and potentially reach a new high of $2.25.
Q: What factors are affecting KAITO’s price?
A: The price is influenced by market demand, technical indicators like BBP and RSI, and broader market conditions.
Q: Where can I learn more about KAITO and market trends?
A: Visit the Bitrue website for in-depth research and analysis before making investment decisions.
Bitrue Official Website:
Website: https://www.bitrue.com/
Sign Up: https://www.bitrue.com/user/register
Disclaimer: The views expressed belong exclusively to the author and do not reflect the views of this platform. This platform and its affiliates disclaim any responsibility for the accuracy or suitability of the information provided. It is for informational purposes only and not intended as financial or investment advice.
Disclaimer: The content of this article does not constitute financial or investment advice.


