Worldcoin (WLD) Price Bounces From Yearly Low: Is the Bottom In?
2024-09-24
Worldcoin (WLD) has been experiencing substantial volatility since reaching its peak price of $12 in March. After a steep correction, the cryptocurrency may now be on the verge of a bullish breakout, with key technical indicators signaling a possible reversal and the beginning of a new rally.
Key Takeaways
- Steep Drop from Peak: WLD dropped from $12 in March to $1.32 in September, losing 88% of its value since its all-time high (ATH).
- Positive Technical Signals: Indicators like the Relative Strength Index (RSI) and MACD are showing bullish signs, with WLD gaining 27% from its recent low.
- Potential Bullish Breakout: A breakout above $1.70 resistance could confirm the start of a new bullish phase, with higher highs expected in the coming months.

Worldcoin Price Analysis
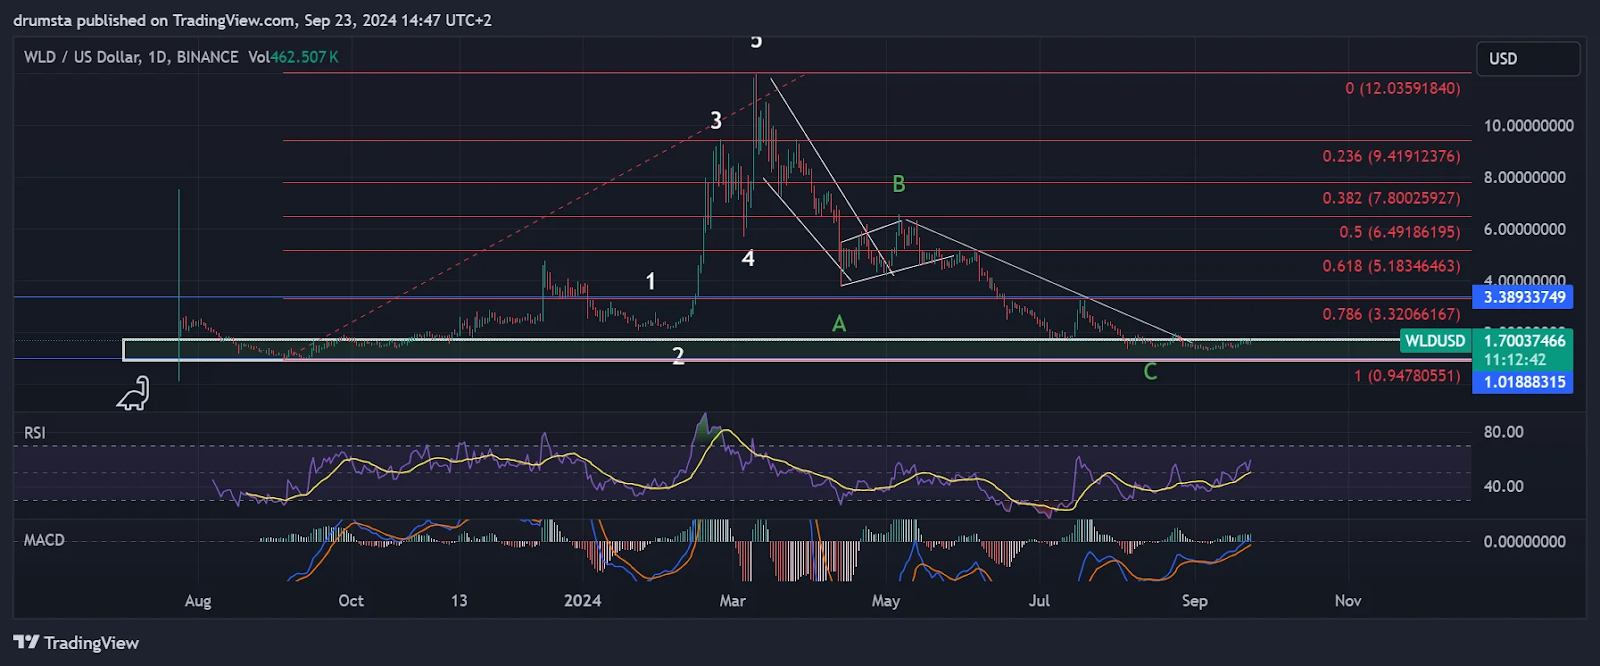
Credit: Nikola Lazic/TradingView
From a peak of $12 on March 10, Worldcoin (WLD) saw a dramatic drop of 69%, landing at $3.73 by April 13, where it closed the day at $4.40. The price then followed an ascending channel, but it failed to regain momentum and continued its correction.
After reaching $6.50 on May 5, WLD entered another downtrend, retracing to earlier support levels. On September 6, the price touched $1.32 and entered a horizontal range, which may mark the completion of an ABC three-wave pattern, suggesting the possibility of an upcoming bullish phase.
Technical Indicators Suggest a Bullish Reversal
Recent movements have shown some positive momentum:
- Relative Strength Index (RSI): Currently showing signs of recovery.
- MACD Indicator: Indicating that WLD might be preparing for a breakout.
The price has increased by 27% from its recent low, hovering near the top of a horizontal range. A breakout above this range would signal a potential rally. However, a rejection could lead to another downturn, so further confirmation is required.

Worldcoin Short-Term Price Prediction
Worldcoin is currently forming a U-shaped bottom, another sign that the $1.30 support level may have been the bottom. A U-shaped bottom pattern often signals a reversal in market direction.
To confirm this bullish trend, the price needs to break through the $1.70 resistance level and stay above it during the expected retest. Developing a five-wave pattern will be the strongest indicator of a sustained rally. Additionally, a higher low above $1.50 on the next downturn will provide further confirmation of a longer-term bullish trend.
If the price movement aligns with these projections, WLD could enter a new sustained bull phase, offering significant upside potential for investors.

Trade & Invite your friends to earn up to 20 $USDT worth of $HMSTR
- New users on Bitrue will receive HMSTR tokens worth 10 USDT for their first trade of any spot pair.
- All users who invite three new users to register on Bitrue and complete any spot trade will receive HMSTR tokens worth 10 USDT.
FAQs
What is causing the recent price movement of Worldcoin (WLD)?
Recent price movements of Worldcoin are likely driven by market corrections following its steep decline from its all-time high, along with positive technical signals such as RSI and MACD indicators suggesting a bullish breakout.
What is the current resistance level for Worldcoin (WLD)?
Worldcoin faces resistance at $1.70. A breakout above this level could signal the start of a new bullish phase.
Is Worldcoin (WLD) a good investment right now?
While there are positive technical indicators, WLD remains highly volatile. A confirmed breakout above key resistance levels would provide stronger support for bullish sentiment.
Disclaimer: The content of this article does not constitute financial or investment advice.


