Quant (QNT) Price Surge: Can the Momentum Push It to New Highs?
2025-03-04
- ing resilience in a volatile market.
- The key resistance levels to watch are $122 and $165, which could determine the next major price direction.
- Technical indicators lean bullish, but confirmation of a long-term trend reversal is still pending.

QNT’s Bullish Breakout and Price Action
Despite a crypto market downturn that wiped out $110 billion in liquidations, QNT managed to break out from a long-term descending resistance trendline. This trendline had been in place for over two years, making its breakout a significant technical event.
Currently, QNT trades near the $92 horizontal support, a level that has been critical for nearly 1,000 days. Historically, assets that withstand market corrections tend to perform well in subsequent recoveries, and QNT appears to be demonstrating that strength.
If the price continues its upward trajectory, the first major test will be at the $122 resistance level. This level aligns with key Fibonacci retracement points and could determine if QNT can push higher toward $165.
Read More: How to Buy Quant (QNT)
Technical Indicators: A Bullish Yet Cautious Outlook
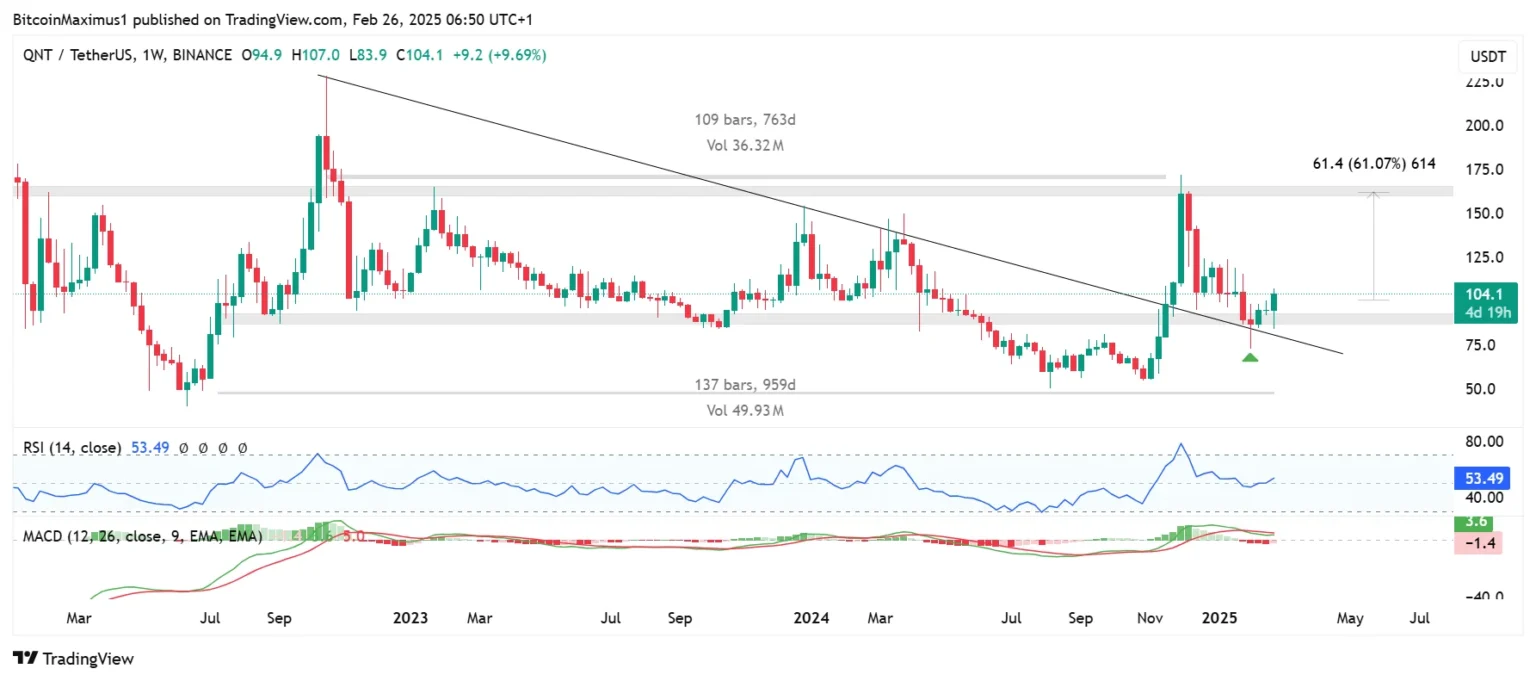
Source: Valdrin Tahiri
From a technical standpoint, QNT exhibits mixed signals:
- The Relative Strength Index (RSI) is slightly above 50, indicating mild bullish momentum but not yet confirming a definitive uptrend.
- The Moving Average Convergence Divergence (MACD) has crossed bullish but remains below zero, suggesting potential for growth but requiring further confirmation.
- The wave count pattern suggests QNT is in wave C of an A-B-C correction, a structure that could facilitate a breakout from the current resistance levels.
While these indicators support a short-term bullish outlook, they do not entirely rule out the possibility of a relief rally before another corrective phase.
Read More: What is Quant Coin? Comprehensive Guide to QNT
What’s Next for QNT?
The price action in the coming days will be crucial in determining QNT’s long-term trajectory. If QNT successfully breaks above $122, it could rally toward $165, marking a 60% increase from current levels. However, failure to surpass this resistance may lead to another pullback, potentially retesting the $92 support level.
As market conditions evolve, QNT’s ability to maintain bullish momentum will depend on broader crypto market trends, investor sentiment, and its fundamental developments.

FAQs
1. What resistance levels should QNT traders watch?
The key levels to monitor are $122, a critical resistance point, and $165, which could signal a long-term bullish breakout.
2. Has QNT confirmed a long-term uptrend?
Not yet. While the price has broken out from a long-term resistance, technical indicators suggest the need for further confirmation.
3. What could cause QNT to decline again?
A failure to break above $122 could lead to a retest of the $92 support level, especially if broader market conditions remain volatile.
Disclaimer: The content of this article does not constitute financial or investment advice.


