Pepe Coin Forms ‘Double Bullish’ Pattern, Signaling Potential 60% Surge
2024-10-15
Pepe (PEPE) is showing signs of a strong accumulation phase, where investors are steadily increasing their holdings in anticipation of a major rally. Despite a decrease in active addresses, technical indicators point to the potential for a significant price breakout. PEPE has already seen a 30.13% gain in the past month, and with its recent bullish trajectory, analysts are eyeing a 60% surge, potentially pushing the price to $0.00001725.
PEPE has formed a new bullish pattern, signaling that it’s entering another accumulation phase. If this pattern leads to a confirmed breakout, the next target price could be $0.00001725, offering a lucrative opportunity for investors.
Key Takeaways
- Double Bullish Pattern: PEPE has formed a second symmetrical triangle, indicating that another breakout may push the price toward $0.00001725.
- Accumulation Phase: The Accumulation/Distribution (A/D) indicator shows that buyers are steadily increasing their PEPE holdings, fueling bullish sentiment.
- RSI Indicator: The Relative Strength Index (RSI) reading of 59.41 signals increasing buyer control and a potential continued upward trend.

PEPE’s Double Bullish Pattern Signals Imminent Breakout
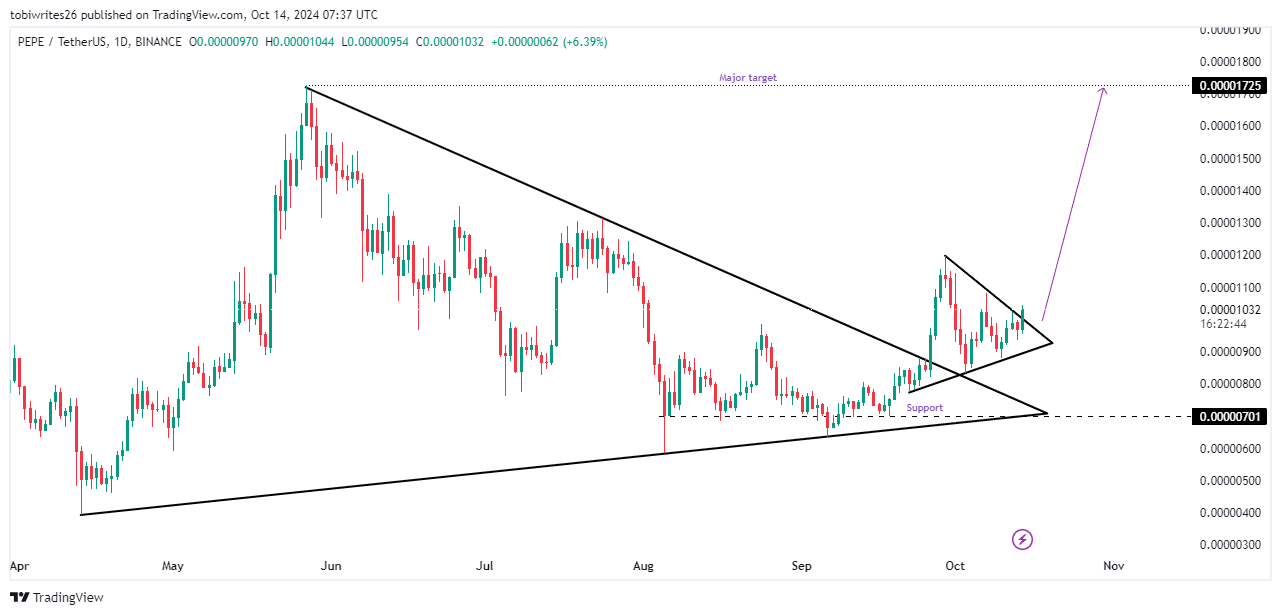
Source: TradingView
PEPE’s price has entered a symmetrical triangle pattern, continuing its breakout from a previous larger triangle. This technical formation, combined with the bullish activity in the market, suggests that a breakout is on the horizon. The Accumulation/Distribution (A/D) indicator is pointing to steady buying, while the RSI is trending upward, showing a healthy balance of buyers pushing PEPE into bullish territory.
Analysts predict that if the price can break out of the current symmetrical triangle, PEPE could hit $0.00001725, representing a potential 60% gain from its current value.
However, a recent decline in active addresses has raised concerns. According to IntoTheBlock, the number of active addresses interacting with PEPE has dropped by 7.89% over the past week. This could delay the breakout or diminish the momentum needed to push PEPE to new highs.
Read More:
PEPE Price Index Live Charts, and Fait Converter

FAQs
What is driving the bullish sentiment for PEPE?
The bullish sentiment is driven by the formation of a symmetrical triangle pattern, strong accumulation signals from the A/D indicator, and rising RSI levels.
What price target is expected if PEPE breaks out?
If PEPE breaks out of the current symmetrical triangle, analysts predict a price target of $0.00001725, representing a potential 60% surge.
What could delay PEPE’s breakout?
A decline in active addresses has been observed, which could slow down the buying momentum and delay the expected breakout.
Disclaimer: The content of this article does not constitute financial or investment advice.


