Bitcoin Price Forecast for February 2025: Insights from the Bitcoin Rainbow Chart
2025-02-13
Bitcoin (BTC) is currently grappling with resistance above $98,000, facing downward pressure amid macroeconomic concerns.
The latest hotter-than-expected Consumer Price Index (CPI) data has reignited inflation fears, sending BTC toward $95,000 and raising the possibility of a further decline to $90,000.
In times of uncertainty, historical indicators like the Bitcoin Rainbow Chart offer valuable insights into potential price trends, shedding light on BTC’s likely trajectory as February 2025 unfolds.
Understanding the Bitcoin Rainbow Chart
The Bitcoin Rainbow Chart categorizes BTC’s price movements into nine color-coded zones, each reflecting different market sentiments—from extreme undervaluation to speculative bubble territory.
These zones provide a long-term perspective on whether Bitcoin is overpriced, fairly valued, or undervalued.
At present, Bitcoin is positioned in the ‘HODL!’ zone, a range that suggests neutral sentiment with no imminent signals of either a sharp sell-off or an explosive rally.
This phase often reflects investor indecision, with traders awaiting the next major catalyst to determine BTC’s direction.
Also read: Hong Kong Ready to Legalize Bitcoin Reserve, Really?
Bitcoin’s Projected Range for February 2025
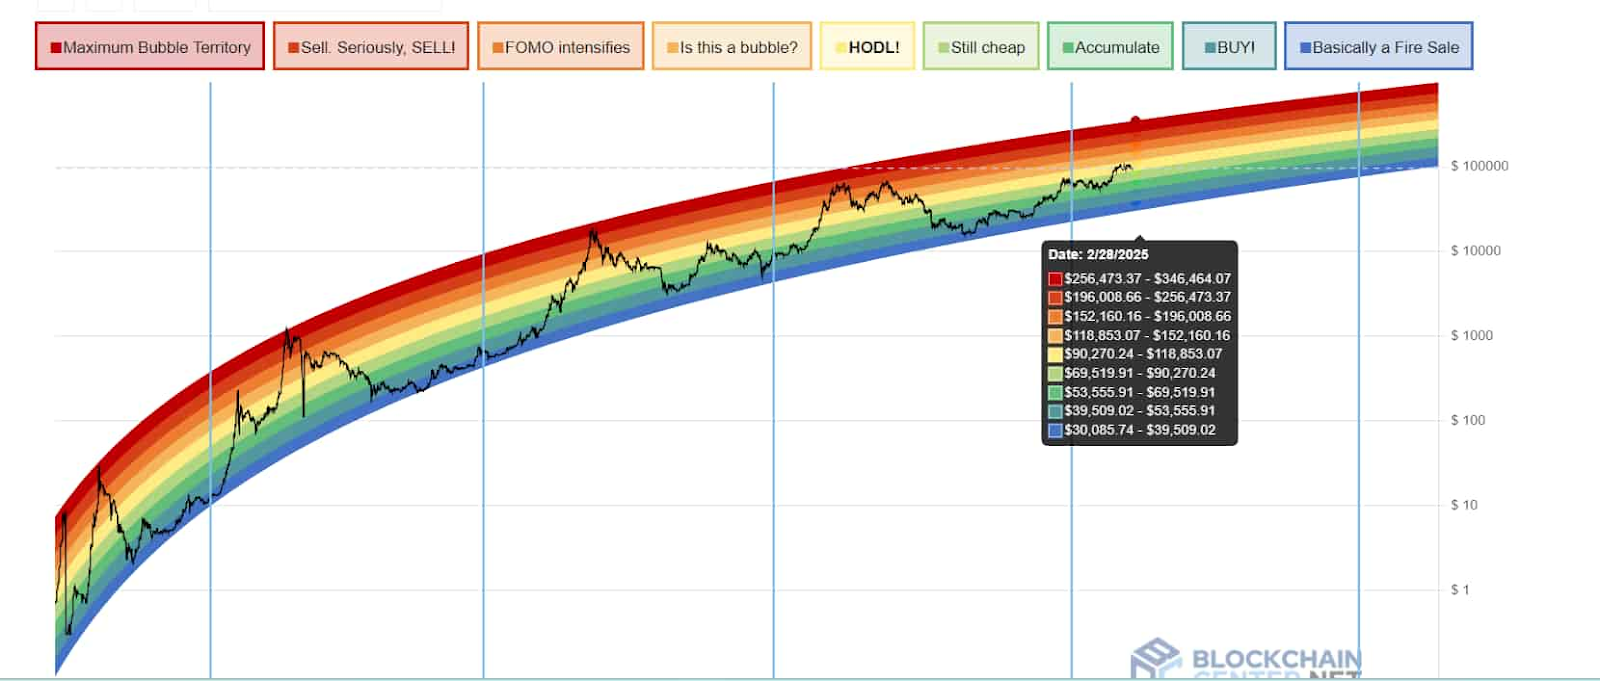
According to the Bitcoin Rainbow Chart, BTC is expected to remain within the ‘HODL!’ range throughout February, provided it trades between $90,270.24 and $118,853.07.
This zone signifies market stability, where Bitcoin is neither deemed significantly undervalued nor at risk of entering extreme speculative territory.
Downside Scenario
A drop below $90,270.24 could push BTC into the ‘Still Cheap’ accumulation zone, historically a level where stronger buying activity emerges.
Key accumulation levels within this range include $69,519.91, $53,555.91, and $39,509.02. However, if Bitcoin falls below $30,085.74, it could signal a fundamental market shift, increasing the likelihood of a broader bearish trend.
Upside Potential
Should Bitcoin rally past $118,853.07, profit-taking could begin among traders who have already secured gains. A more pronounced speculative phase may emerge if BTC surpasses $152,160.16, a level where FOMO-driven buying typically accelerates.
Also read: For the Sake of BTC: James Howells’ Bold Plan to Buy a Landfill for His Lost Bitcoin Fortune
Key Takeaways for Investors
The Bitcoin Rainbow Chart suggests that BTC is likely to stay within the ‘HODL!’ zone or drift toward the accumulation phase by the end of February.
This scenario presents continued buying opportunities for long-term investors seeking strategic entry points. However, traders should remain vigilant, as macroeconomic factors and broader market sentiment will play a critical role in determining Bitcoin’s short-term price trajectory.
While the chart provides historical guidance, Bitcoin remains a highly volatile asset, and external catalysts—such as regulatory developments or unexpected economic shifts—could swiftly alter its course. Investors should balance technical indicators with fundamental analysis to navigate the market effectively.
Read more about Bitcoin (BTC):
Bitcoin Price (BTC), Market Cap, Price Today & Chart History
BTC to USD: Convert Bitcoin to US Dollar
FAQ
1. What is the Bitcoin Rainbow Chart?
The Bitcoin Rainbow Chart is a historical price model that categorizes BTC’s price movements into nine color-coded zones, helping investors gauge whether Bitcoin is undervalued, fairly priced, or in speculative bubble territory.
2. What does it mean if BTC is in the ‘HODL!’ zone?
The ‘HODL!’ zone suggests a neutral market sentiment where neither a sharp sell-off nor a major rally is expected. It indicates a stable price range where investors typically hold onto their BTC rather than aggressively buying or selling.
3. What is the significance of the $90,270.24 support level?
If Bitcoin drops below $90,270.24, it could enter the ‘Still Cheap’ accumulation phase, where past trends indicate increased buying interest. This level is crucial for traders looking for lower entry points.
4. Could Bitcoin break above $118,853.07 in February?
While possible, Bitcoin would need strong bullish catalysts—such as favorable regulatory news, institutional inflows, or macroeconomic stability—to surpass this level. Otherwise, profit-taking could limit further gains.
5. Is the Bitcoin Rainbow Chart a reliable prediction tool?
The Rainbow Chart offers a historical perspective on Bitcoin’s price behavior, but it is not a guaranteed prediction model. Market conditions, macroeconomic factors, and unforeseen events can impact BTC’s price outside of historical trends.
Disclaimer: The content of this article does not constitute financial or investment advice.


