Bitcoin Shows Signs of Recovery: Fear and Greed Index Insights
2024-10-02
Bitcoin (BTC) has been navigating a complex price landscape since its breakout from a descending channel established in July. After hitting a peak of $66.5k, the asset experienced a notable reversal, leading to questions about whether this marks a local top or the beginning of a recovery.
Crypto market intelligence platform Santiment recently noted a surge in bullish sentiment among traders, which typically raises concerns about a potential market top. This sentiment culminated in a nearly 5% price drop on Monday, leading many to wonder if the market is set for recovery or if the recent peak will hold as the local high.
Key Takeaways
- Current Sentiment: The Bitcoin Fear and Greed Index shows neutral sentiment, indicating a potential recovery phase despite recent price dips.
- Failed Breakout: After reaching a local high of $66.5k, Bitcoin's price retraced, highlighting a lack of bullish conviction in the market.
- Long-Term Valuation: Key indicators like the Rainbow Chart suggest Bitcoin is currently undervalued, presenting a buying opportunity as the market prepares for a historically bullish Q4.

Bitcoin Fear and Greed Index Analysis
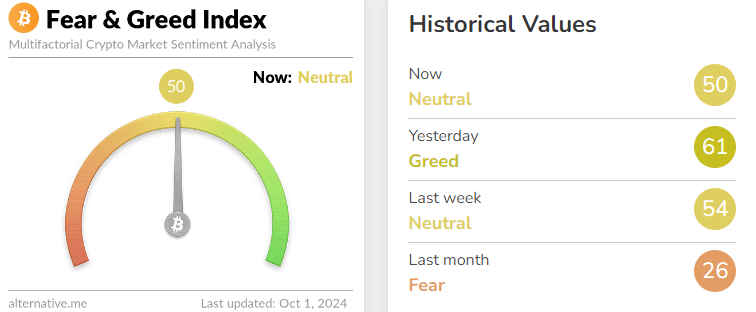
Source: Alternative.me
The Fear and Greed Index provides valuable insights into market sentiment. Currently showing neutral readings, this index has been predominantly neutral or fearful in recent weeks. This score is derived from various factors, including volatility, market volume, social media engagement, and Bitcoin's dominance in the market.
Recent analysis by AMBCrypto highlighted that while the index has increased over the past three months, it has yet to cross into "greedy" territory, suggesting that there may still be room for growth without triggering panic selling among investors.
The Technical Landscape
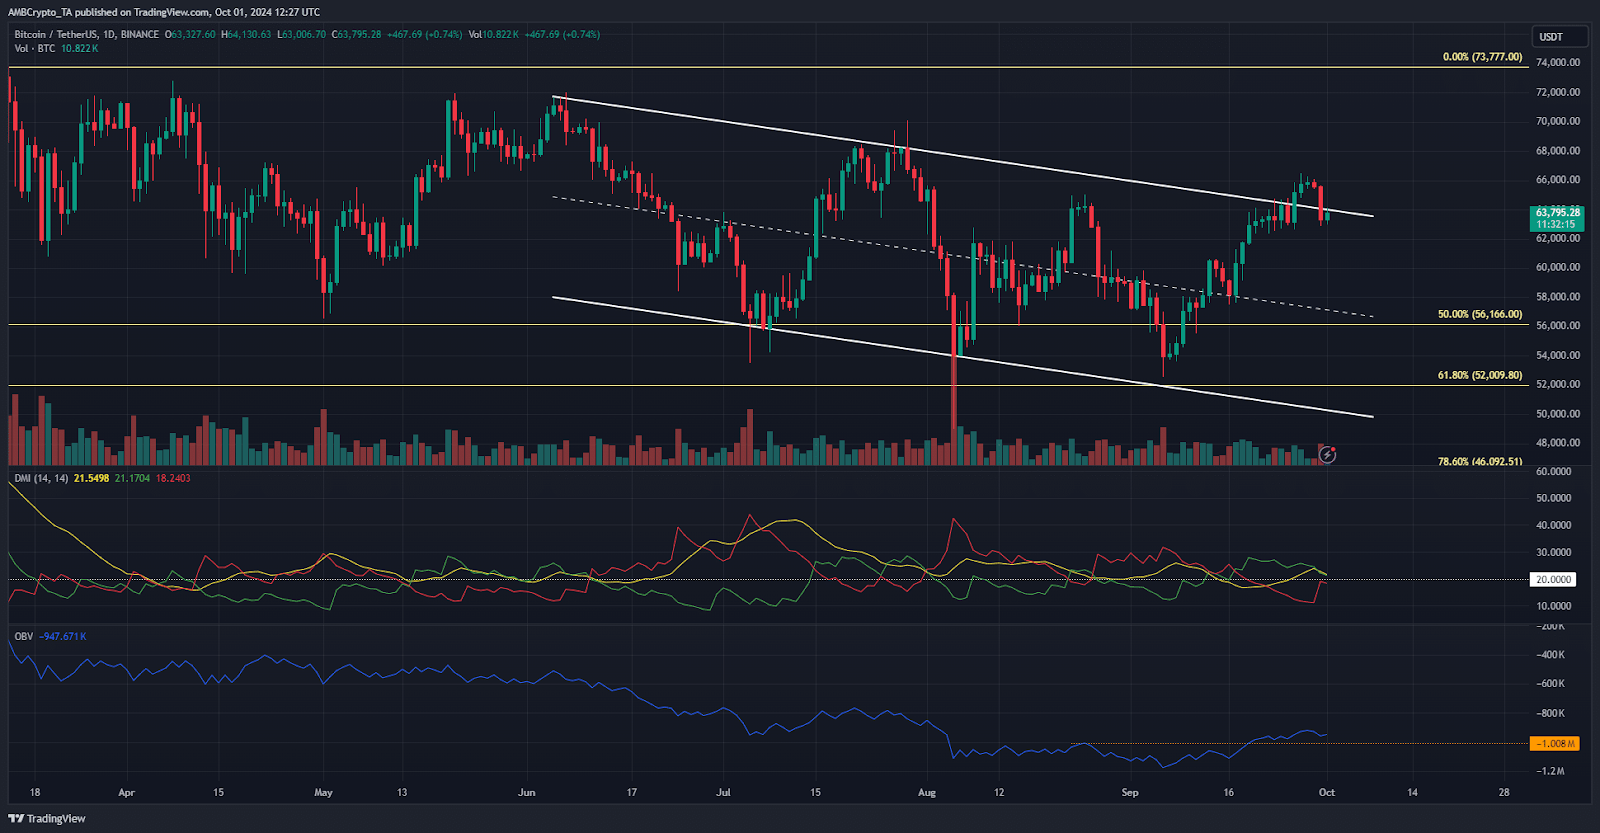
Source: TradingView
Despite a strong bullish structure, Bitcoin's recent breakout failed to sustain momentum. Since June, the price action has been characterized by a series of lower highs and lower lows. The most recent attempt to breach the $65k resistance was short-lived, as Bitcoin quickly fell back into the $64k-$66k range.
Indicators such as the On-Balance Volume (OBV) had initially cleared local highs but did not indicate strong buying interest, prompting profit-taking among bulls. The Directional Movement Index (DMI) showed a strong uptrend during the breakout, but as the +DI and ADX metrics decline, the market may be heading towards the $60k-$61.5k support zone.
Looking Ahead
Despite the current challenges, the Bitcoin Rainbow Chart and other valuation metrics point towards a potentially undervalued asset. Market analysts believe that if Bitcoin maintains its current price range and the macroeconomic factors remain favorable, there may be substantial upside in the upcoming quarters.
In conclusion, while the recent price action has been volatile, the combination of a neutral sentiment from the Fear and Greed Index and key indicators pointing to an undervalued Bitcoin suggests that long-term investors may find current prices attractive.

FAQs
What does the Fear and Greed Index indicate for Bitcoin?
The Fear and Greed Index gauges market sentiment, with current neutral readings suggesting there may still be potential for recovery and growth without triggering panic among investors.
Is Bitcoin currently undervalued?
Yes, several valuation metrics, including the Rainbow Chart and Puell Multiple, indicate that Bitcoin is relatively undervalued, presenting potential buying opportunities for investors.
What should investors watch for in the upcoming quarters?
Investors should keep an eye on macroeconomic factors, market sentiment, and key technical levels to gauge Bitcoin's price direction, especially as historically bullish trends emerge in Q4.
Disclaimer: The content of this article does not constitute financial or investment advice.


