Is AAVE Overbought After a 30% Weekly Surge? Analyzing the Recovery and Future Projections
2024-09-24
AAVE has seen a dramatic price surge, rising by 9% during a single U.S. trading session and registering a 30% weekly gain. The altcoin reached $176, breaking a two-year accumulation trend, sparking speculation about whether this bullish momentum can continue. As the AAVE price continues to climb, analysts are assessing whether it has entered overbought territory, signaling a potential pullback.
Key Takeaways
- Breakout from Two-Year Accumulation Trend: AAVE saw a significant breakout at $153, backed by substantial trading volume, marking a decisive end to its two-year accumulation phase.
- Rounding Pattern Formation: The price action on the weekly chart hints at a Rounding Pattern, signaling a transition from a downtrend to accumulation and now a momentum-driven recovery.
- Potential for Short-Term Pullback: Despite strong whale accumulation and bullish sentiment, overextended technical indicators suggest a potential pullback as the market stabilizes.

AAVE Price Rally: Overbought or Sustainable?
Last week, AAVE soared from $134 to $176, marking a 32% rise and breaking through the $153 resistance level. This surge follows a prolonged accumulation phase, with analysts now monitoring whether this marks the start of a long-term recovery or if a bearish correction is imminent.
Rounding Pattern Signals Potential for Further Growth
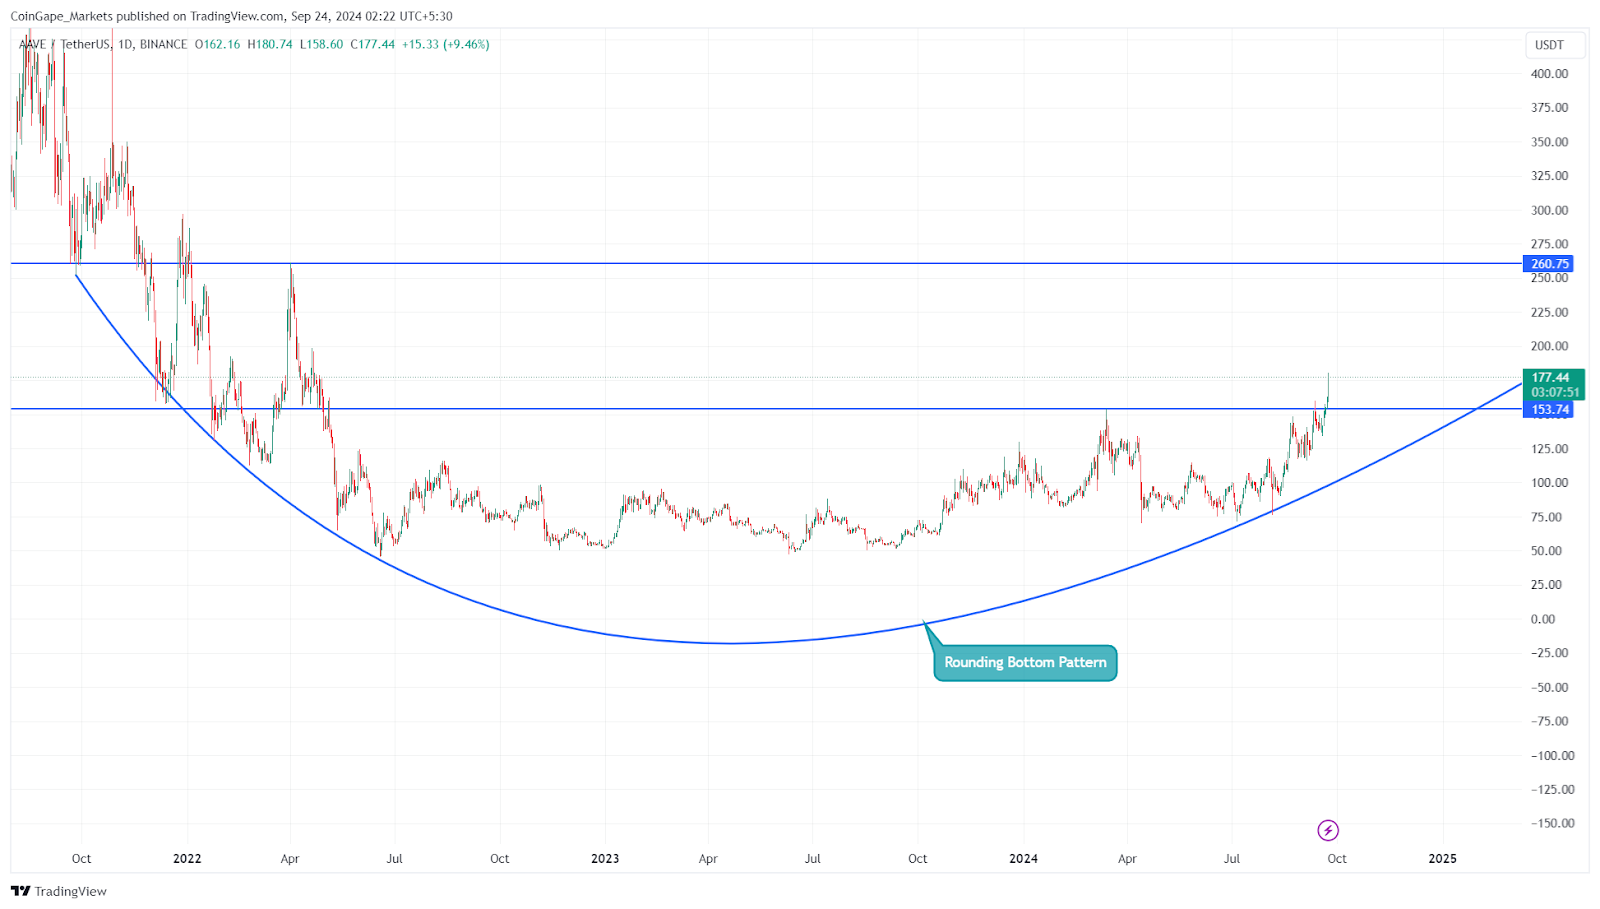
Source: CoinGape
The current chart pattern, a Rounding Pattern, often signals a reversal from long-term downtrends to sustained recoveries. This saucer-like shape could indicate that AAVE is transitioning into a new growth phase. If the momentum continues, the next target for AAVE is the $200 psychological resistance level, followed by a potential rise to $260.

Whale Accumulation Bolsters Recovery
Santiment data reveals that whale wallets holding between 1 million to 10 million AAVE tokens have been accumulating since early August 2024, now holding a combined total of $4.2 million in AAVE. This large-scale accumulation suggests that market movers are betting on a continued rally, which could significantly influence AAVE's short-term performance.
Technical Indicators Hint at Pullback Risk
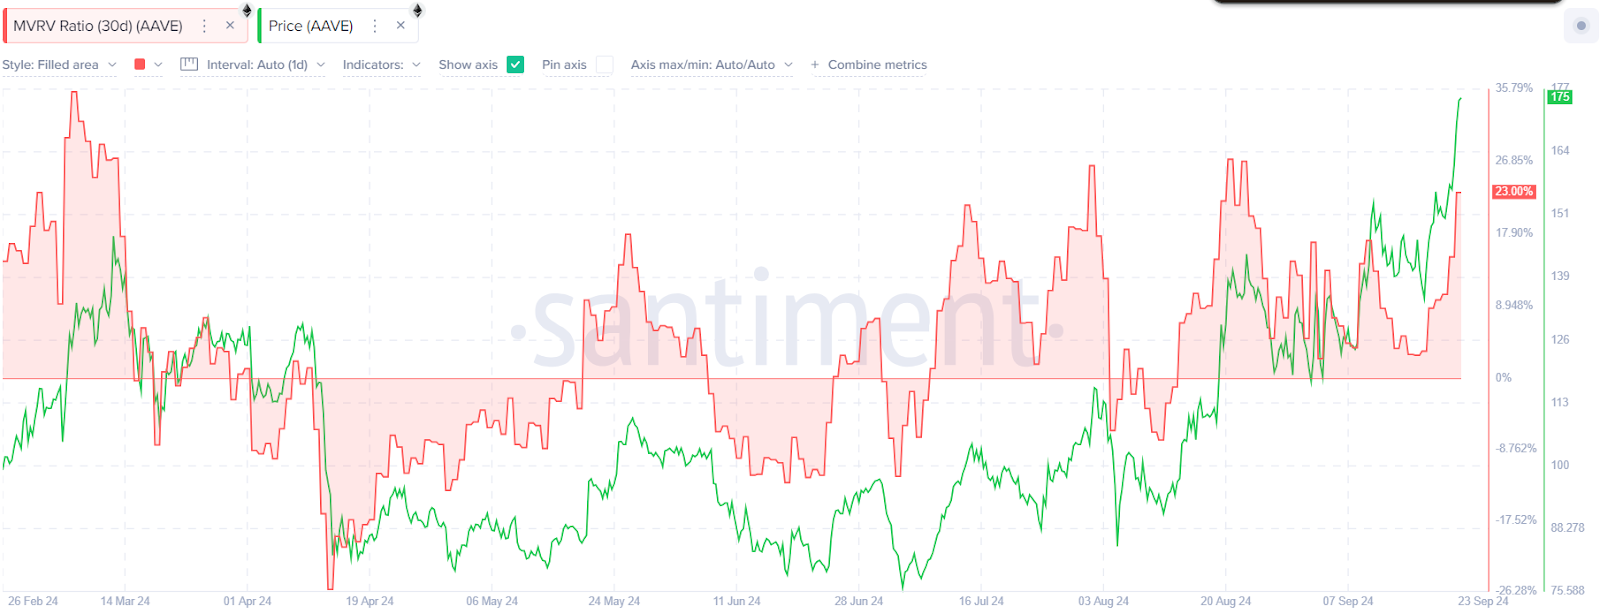
Source: CoinGape
However, AAVE’s price has pulled far away from its 20-day and 50-day exponential moving averages (EMA), which may signal an impending correction. Additionally, the Average Directional Index (ADX) has surged to 35%, suggesting that buyers could soon face exhaustion.
The 30-day Market Value by Realized Value (MVRV) ratio also surged by 23%, indicating that short-term traders are currently in profit. Historically, when the MVRV ratio hits these levels, speculative traders often cash out, leading to short-term price corrections.

Trade & Invite your friends to earn up to 20 $USDT worth of $HMSTR
- New users on Bitrue will receive HMSTR tokens worth 10 USDT for their first trade of any spot pair.
- All users who invite three new users to register on Bitrue and complete any spot trade will receive HMSTR tokens worth 10 USDT.
FAQs
Is AAVE currently overbought?
Yes, technical indicators suggest that AAVE may be overbought after its recent 30% rally, increasing the likelihood of a temporary pullback.
What are AAVE’s next price targets?
If the bullish trend continues, AAVE could challenge the $200 resistance level and potentially surge to $260. However, a short-term pullback could happen first.
What role do whales play in AAVE’s price movement?
Whales have been accumulating AAVE tokens, which signals confidence in the token’s long-term potential. This accumulation could support further price growth or stabilize any upcoming corrections.
Disclaimer: The content of this article does not constitute financial or investment advice.


