Solana Price Poised for Rally as On-Chain Activity Surges: A Deep Dive
2024-07-11The Solana blockchain is exhibiting signs of a potential price surge, with analysts dissecting a bullish technical pattern and a significant increase in on-chain activity.
On June 12th, the SOL token price jumped 7% to reach $160, mirroring a broader market recovery. This positive sentiment stemmed from the release of lower-than-expected US inflation data. The data suggests a less hawkish monetary policy, which generally translates to more favorable liquidity conditions for riskier assets like cryptocurrencies. This has instilled renewed confidence among investors, potentially leading to a surge in demand for SOL.
Technical Analysis: Decoding the Symmetrical Triangle
Over the past three months, the SOL price chart has been characterized by a symmetrical triangle pattern. This pattern is formed by two converging trendlines, one acting as support and the other as resistance.
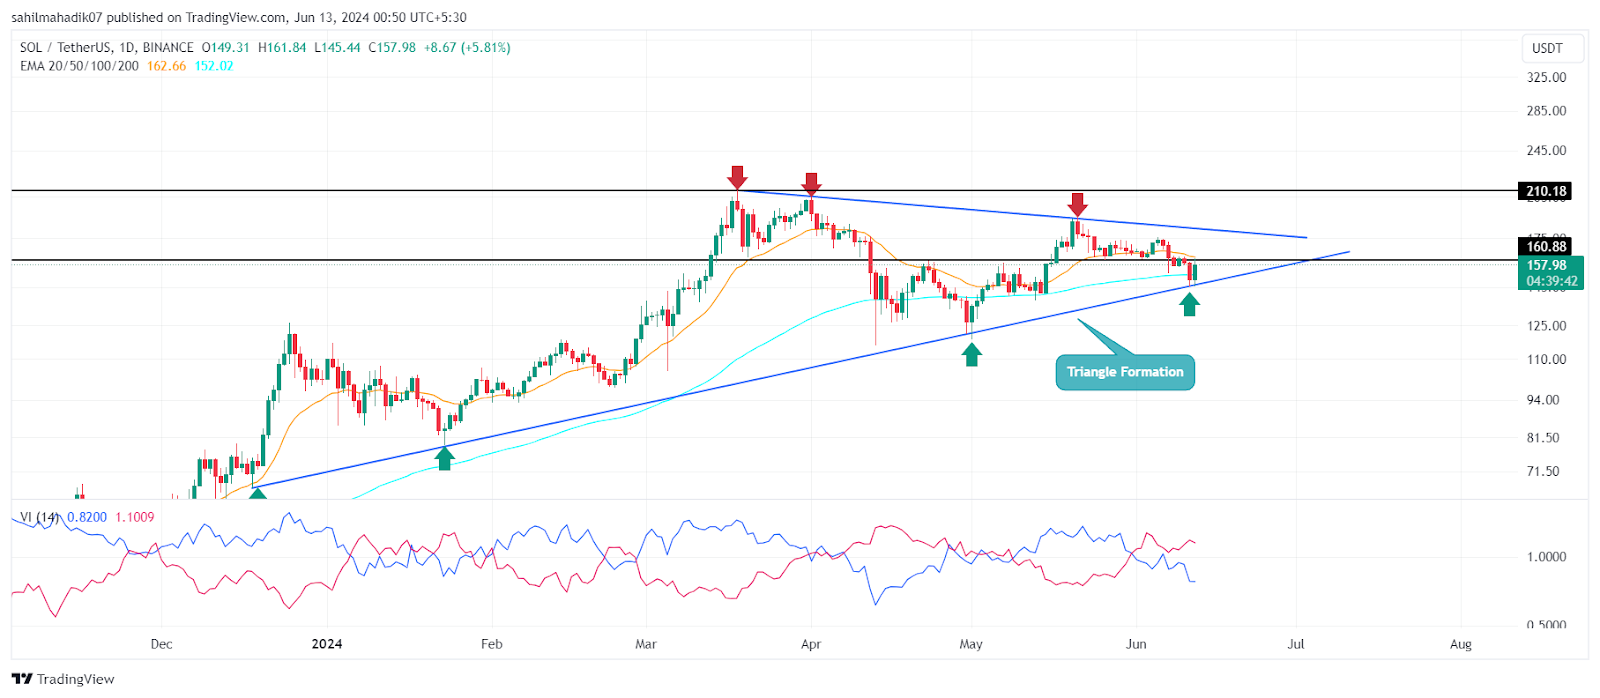
The sideways price movement within the triangle can be interpreted as a period of consolidation. However, this pattern also has a historical tendency to precede a breakout in either direction, upwards or downwards.
On-Chain Activity: A Sign of Growing Adoption
While the price action has been relatively flat, Solana's on-chain metrics have painted a contrasting picture. A recent report by The Block revealed a significant uptick, with the number of new addresses on the Solana network growing by approximately 33.8% since May 2nd. This substantial increase in new user activity indicates rising interest and adoption of the Solana platform. This strong foundation of active users could translate to increased demand for SOL in the future,potentially pushing the price upwards.
Read more: Solana DeFi Gears Up: Unveiling the Next Stage of Decentralized Finance
Price Prediction: Unveiling Potential Scenarios
The recent price rebound from the triangle's support level hints at a potential bullish breakout for SOL. Based on historical trends associated with this pattern, a breakout could see the price rise by 12% to reach $178, hitting the overhead resistance trendline.
However, the current surge in network activity and the broader bullish market trend paint a more optimistic picture. If buyers manage to overcome the overhead resistance and establish it as new support, the SOL price could potentially reach $210, followed by a further climb to $310. This bullish scenario would represent a significant increase from its current price point and solidify Solana's position as a major player within the blockchain ecosystem.
Technical Indicators: A Look Under the Hood
While the SOL price trading above its 100-day exponential moving average (EMA) indicates a positive long-term trend, the presence of a negative crossover on the Vortex Indicator suggests ongoing selling pressure. This could potentially prolong the consolidation phase. This situation highlights the importance of employing a combination of technical analysis and on-chain metrics to gain a comprehensive understanding of the factors influencing SOL's price movement.
Read more: Solana (SOL) Bumps Against $190 Barrier, Can it Break Through?
Looking Ahead: Beyond the Charts
The success of any potential SOL price rally will hinge on several factors beyond just technical analysis and on-chain activity. Continued positive developments within the Solana ecosystem, such as the launch of new projects and integrations with Decentralized Finance (DeFi) protocols, could further fuel investor interest and drive the price upwards. Additionally, broader market sentiment and the evolving regulatory landscape surrounding cryptocurrencies will also play a significant role in shaping SOL's price trajectory.
Conclusion: Weighing the Evidence
The technical analysis and on-chain activity metrics for Solana present a compelling case for a potential price rally. The symmetrical triangle pattern and the surge in new addresses suggest pent-up buying pressure that could propel SOL towards new highs.
However, the inherent volatility of the cryptocurrency market necessitates thorough research and cautious investment decisions. Closely monitoring market conditions and technical indicators will be crucial for navigating the upcoming price movements for SOL.
Website: https://www.bitrue.com/
Sign Up: https://www.bitrue.com/user/register
Disclaimer: Bitrue reserves the right in its sole discretion to amend or cancel this announcement at any time and for any reason without prior notice.
Cryptocurrency markets are highly volatile and can experience rapid price fluctuations. You may lose some or all of your invested capital, and past performance is not indicative of future results. You are solely responsible for your investment decisions and Bitrue is not liable for any losses you may incur. The information provided on this platform and any associated materials are for informational purposes only and should not be considered as financial or investing advice.
Disclaimer: The content of this article does not constitute financial or investment advice.


